Web Console
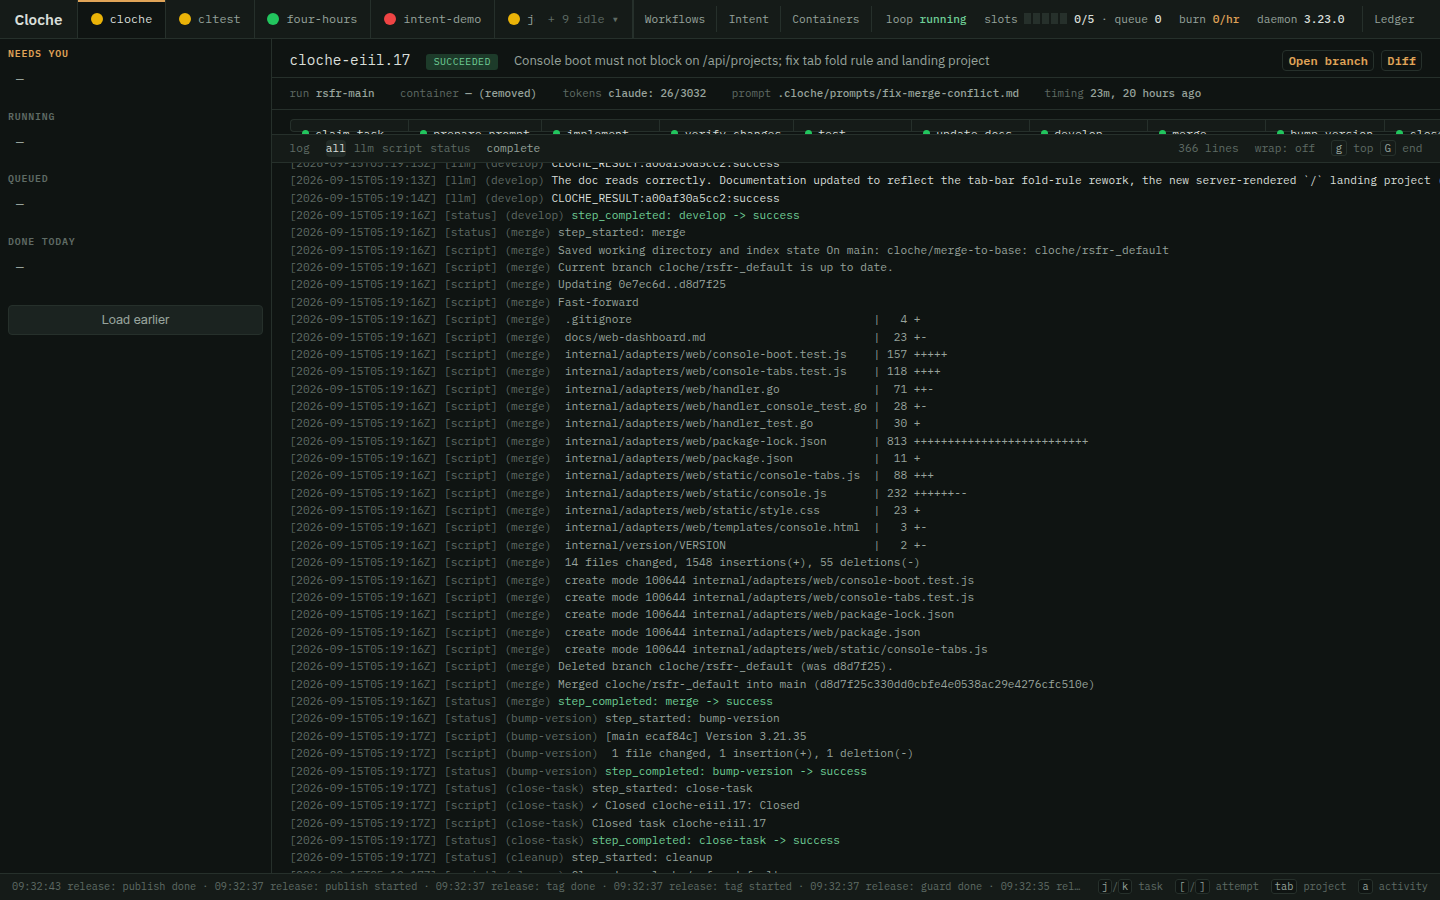
The web console is a browser UI for monitoring and managing Cloche runs. It is a single page — a project tab bar, a task stack, and a full-width task detail pane with live logs — so you can follow work, act on anything that needs a human, and review outcomes without the CLI.
Enabling the Console
cloche init creates ~/.config/cloche/config with the console enabled on localhost:8080 by default. Start the daemon and open http://localhost:8080.
To enable it manually, set http in ~/.config/cloche/config:
[daemon]
http = "localhost:8080"
Or pass it as an environment variable:
CLOCHE_HTTP=localhost:8080 cloched
The console is not started if http is unset (and CLOCHE_HTTP is not set). Choose any available port; use 127.0.0.1:8080 to bind a specific interface. cloche health also requires CLOCHE_HTTP, since it talks to the daemon’s HTTP API. cloche tasks falls back to localhost:8080 when CLOCHE_HTTP is unset.
If the port is still held by a previous daemon when the new one starts, the daemon keeps retrying the bind with exponential backoff (1s up to 30s) until it succeeds. While the listener is down, cloche status shows Web: DOWN (<error>) and cloche health reports that the daemon is otherwise healthy.
The Console
Tab bar
Across the top: one tab per registered project, each with a health dot, a running-count badge, and an attention flag when something needs you. The active project and any project with live activity (a running loop, active runs, or attention items) always stay visible; a fixed number of remaining slots go to the most recently active projects, and only stale, inactive projects beyond that fold into a More menu. Clicking a tab (or pressing Tab / Shift+Tab) switches projects without a page load.
To the right are three view buttons — Workflows, Intent, Containers — and the daemon instruments for the active project:
| Instrument | Meaning |
|---|---|
| Loop | Orchestration loop state (running / stopped). Click to start or stop it. |
| Slots | Concurrency slots as pips, busy/max, plus how many tasks are queued waiting for a slot. |
| Burn | Combined token burn rate across agents over the last hour. |
| Daemon | The daemon’s version. |
| Ledger | Opens the project ledger overlay (see Ledger). |
Task stack
The left rail groups the active project’s tasks into Needs you, Running, Queued, and Done today, with a Load earlier button that pages further into history. Each row shows a coloured status dot, the task ID and title, and a right-aligned elapsed time or reason. The stack polls every few seconds using conditional requests, so only rows that actually changed are redrawn.
Click a row, or move with j / k and press Enter, to open it in the centre pane.
Task detail
The centre pane shows the selected task:
-
Header — task ID, a state pill (running / needs you / queued / succeeded / failed / parked, with the parked duration), the title, and actions that depend on state:
State Actions running Console (raw container output), Workflow (step and wire summary), Cancel done Open branch, Diff, Delete container queued / parked Cancel needs you Whatever the attention item offers — see Needs you -
Facts row — a single wrapping strip. When a task has more than one attempt, it starts with a group of attempt chips (attempt number and short run ID; outcome and duration in the tooltip; the current and any failed attempts coloured distinctly;
[/]switch between them). The rest is the selected attempt’s top-level run ID, child run IDs, container ID and state, token usage per agent, the prompt file and git revision used, and, on a retried attempt, which step the previous attempt failed at. -
Step strip — one segment per step of the top-level run, with a spawned child run’s steps inlined right after the workflow step that spawned them: the parent gets a
↳marker and its children render shaded and indented. Each segment shows a result dot and duration; poll steps also show their last poll time and count. Click a segment to scope the log to that step; click again to clear. -
Log — the full pane width, topped by a status band: a scope chip (
log, orlog · <step> ✕when scoped), a type filter as chips (all / llm / script / status), a click-to-toggle live/follow indicator, and a right-aligned line count, wrap toggle, andg/Ghint. Unscoped, the pane streams the attempt’s log over SSE, replaying the last ~1000 lines with load earlier paging. Every line keeps its timestamp, type, and originating step; tool calls and pass / fail / warning output are coloured semantically. The indicator reads● live(plus· followingwhile follow is on),completeonce the run finishes, ordisconnectedon a stream error.
Needs you
The Needs you group collects tasks that are waiting on a human. The same set appears in cloche status (see the CLI reference); thresholds live under [attention] in config.toml.
| Kind | Meaning | Actions |
|---|---|---|
parked |
A run is parked awaiting a reply on a help thread. | Reply in the parked pane |
stale-claim |
The tracker shows the task in progress, but no run is claiming it. | Release claim |
repeat-failure |
A task still open in the tracker has failed too many times in a row. | Run once…, Close in tracker |
long-poll |
A poll step has been waiting longer than the configured threshold. | Logs, Cancel |
builtin-failures |
A built-in workflow (e.g. intent-scan) has failed repeatedly within the failure window. |
Run once…, Mute |
For stale-claim and repeat-failure items, a one-sentence why-line appears under the header and the log area opens in a compare view: one column per failed attempt (the last three), each trimmed to start at its first failure-looking line. Press c to toggle between the compare view and the ordinary single-attempt log.
The actions:
- Release claim (
r) runs the project’srelease-taskhost workflow to return the task toopenin your tracker. - Close in tracker (
x) runs the project’sclose-task(orcancel-task) host workflow. The button is disabled with a hint when the project defines neither. See the orchestration model. - Run once… dispatches a single attempt of a workflow you choose (with an optional prompt) for the task, outside the orchestration loop.
- Mute permanently suppresses a built-in workflow’s repeated-failure item.
All of them refresh the task stack in place rather than reloading the page.
Parked pane
When the selected task’s run is parked awaiting a help-thread reply, the step strip freezes on the step that parked and the log pane is replaced by the thread: the agent’s question, any prior exchanges, and a reply box. Submitting a reply goes through the same path as cloche threads reply, including resuming the run. The pane keeps polling, so once the run resumes the step strip, facts, and log pick back up on their own. See cloche threads for the CLI side.
Routing
URLs follow /{project-slug} and /{project-slug}/{task-id}. Selecting a project or task updates the URL without a reload, and browser back / forward work as expected. Attempt and step-scope selection are client-side state and not yet reflected in the URL.
/ renders the console directly, seeded with the project that most recently started a run; once loaded, the client prefers the last project you viewed (remembered in localStorage). The pre-console URLs (/projects/{name}, /runs/{id}, /tasks/{id}, /failed-tasks) redirect into the new scheme for one release.
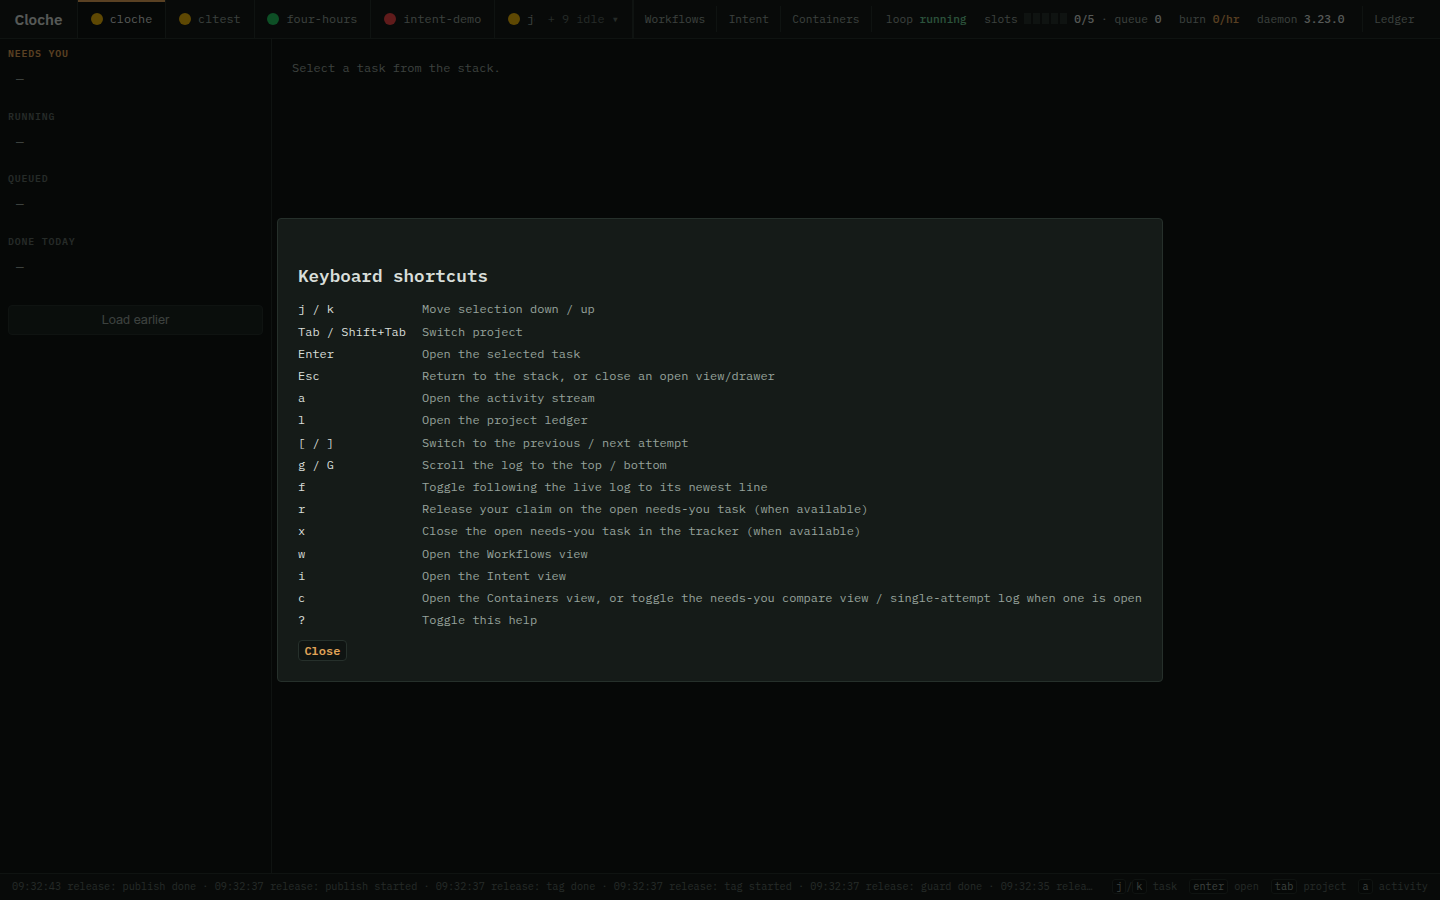
Keyboard
| Key | Action |
|---|---|
j / k |
Move the stack selection down / up |
Tab / Shift+Tab |
Switch to the next / previous project |
Enter |
Open the selected task |
Esc |
Close an open drawer or view, else return to the stack |
[ / ] |
Switch to the previous / next attempt |
g / G |
Scroll the log to the top / bottom |
f |
Toggle following the live log |
r / x |
Release the claim on / close in tracker the open needs-you task (when offered) |
c |
Open the Containers view, or toggle the compare view when a needs-you task is open |
w / i |
Open the Workflows / Intent view |
l |
Open the project ledger |
a |
Open the activity stream |
? |
Toggle the shortcuts overlay |
Foot bar
The foot bar carries a one-line activity ticker on the left and a short set of key hints on the right. The hints change with the selected task’s state (a running task shows f for follow; a needs-you task shows whichever of r / x its item offers); the full list stays behind ?.
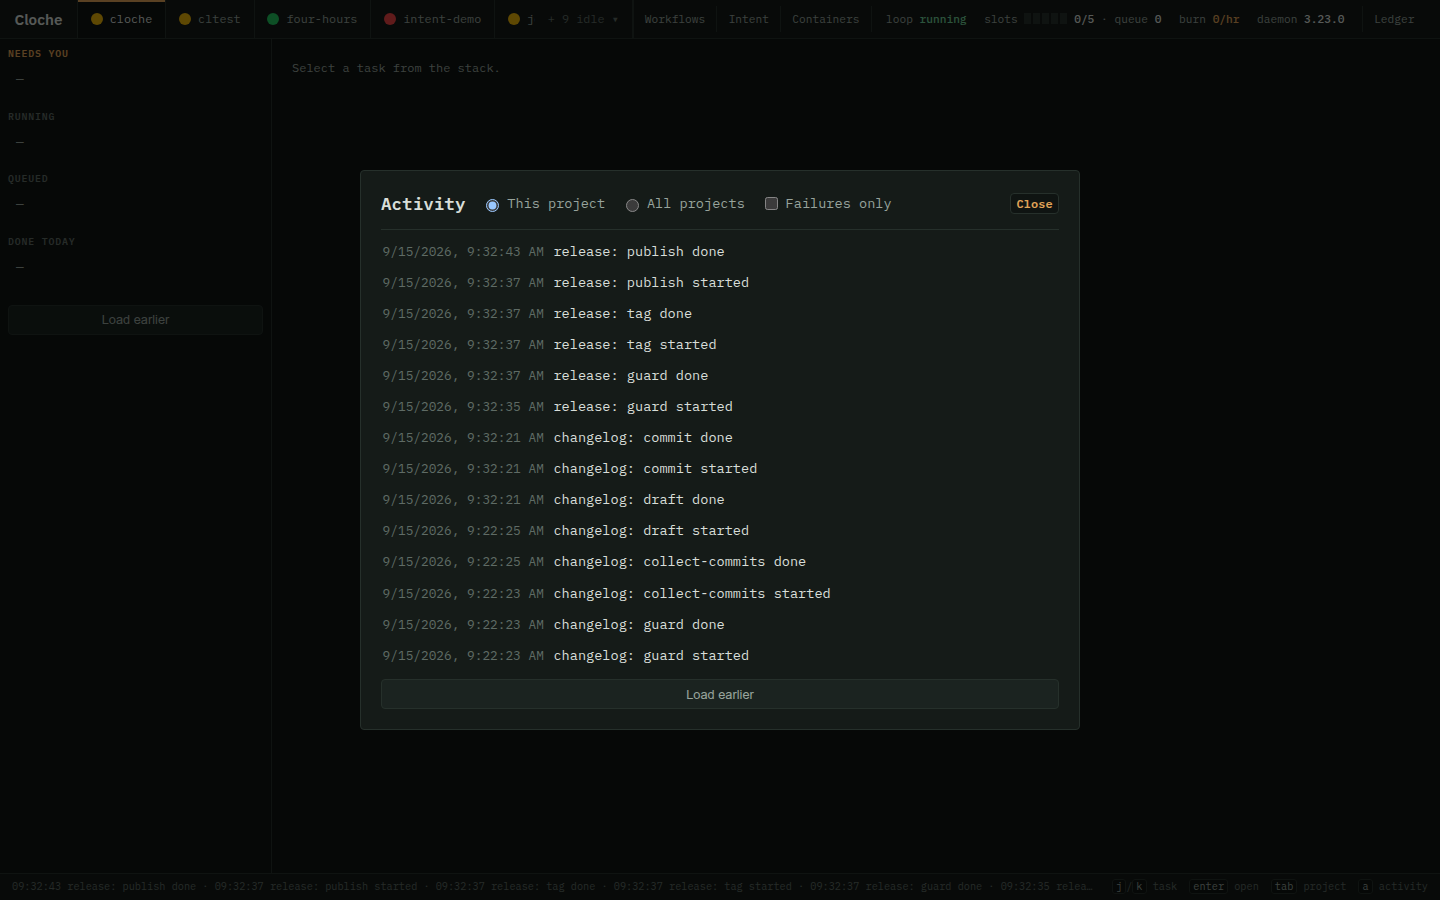
The ticker packs the most recent activity events for the active project onto the line, newest first, each prefixed with its time and with failures coloured red. Repeated events with the same signature on the same day collapse into one entry with a count, e.g. intent-scan failed · 8th today.
Clicking the ticker (or pressing a) opens the activity stream overlay, with This project / All projects and Failures only filters. The stream is always a bounded tail: the first page covers today, and Load earlier pages further into history.
Secondary views: Workflows, Intent, Containers
Three header buttons (and w / i / c) open project-scoped views as an overlay on top of the console, without leaving the current project or task URL. Esc closes the topmost drawer first, then the view.
Workflows
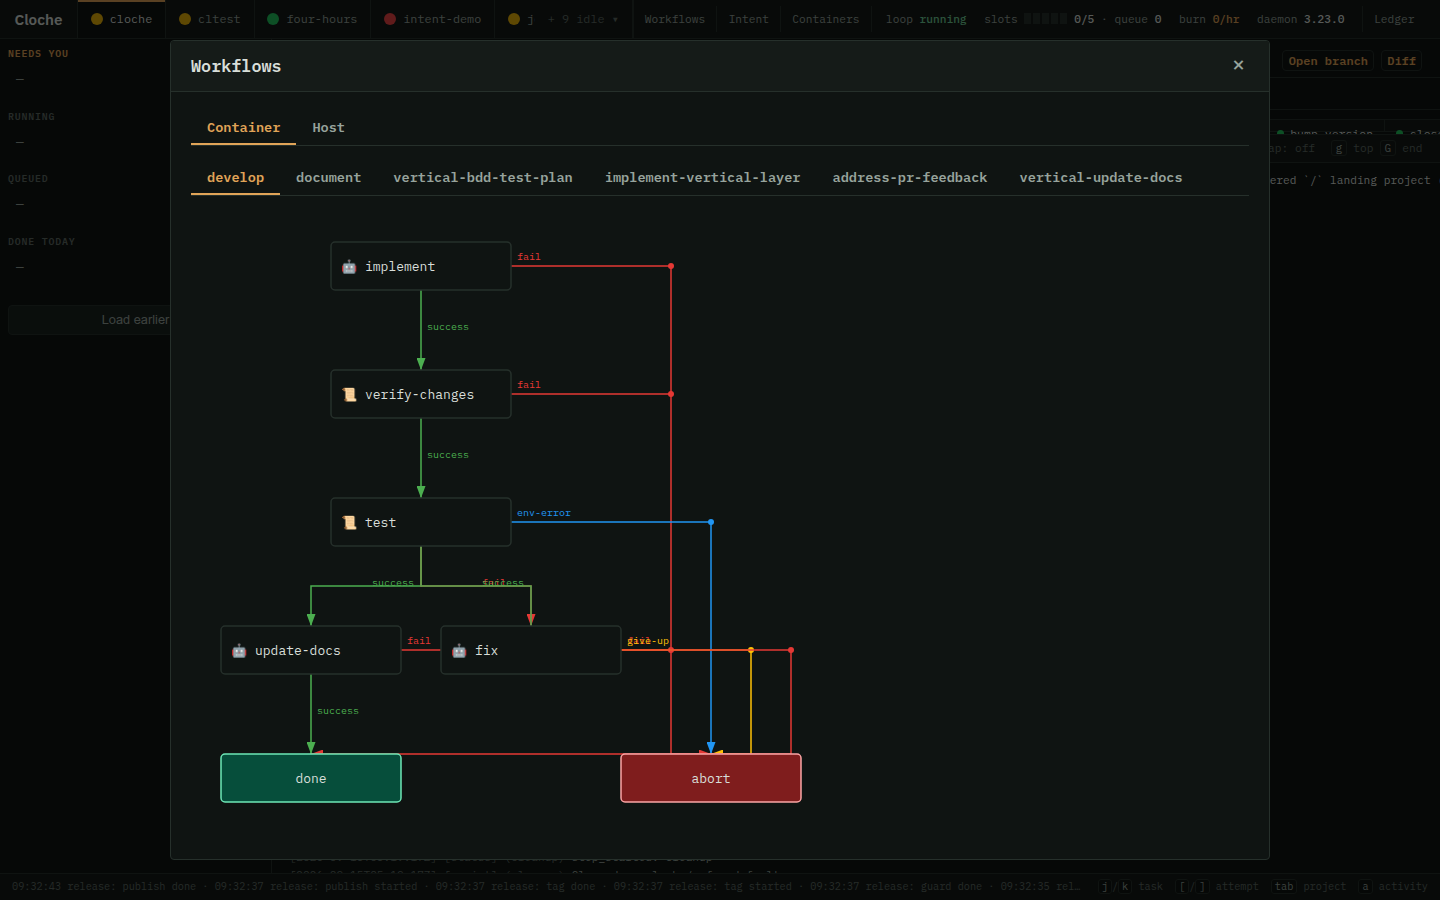
A read-only DAG of steps and wires for the active project’s container and host workflows, with tabs when more than one applies. Built-in workflows carry a built-in badge. Click a step node to open a drawer with its type, results, the config keys it uses (prompt, run, poll, interval, agent, agent_command, agent_args, intent_tracking, workflow_name, max_attempts), and the referenced prompt or script content.
Intent
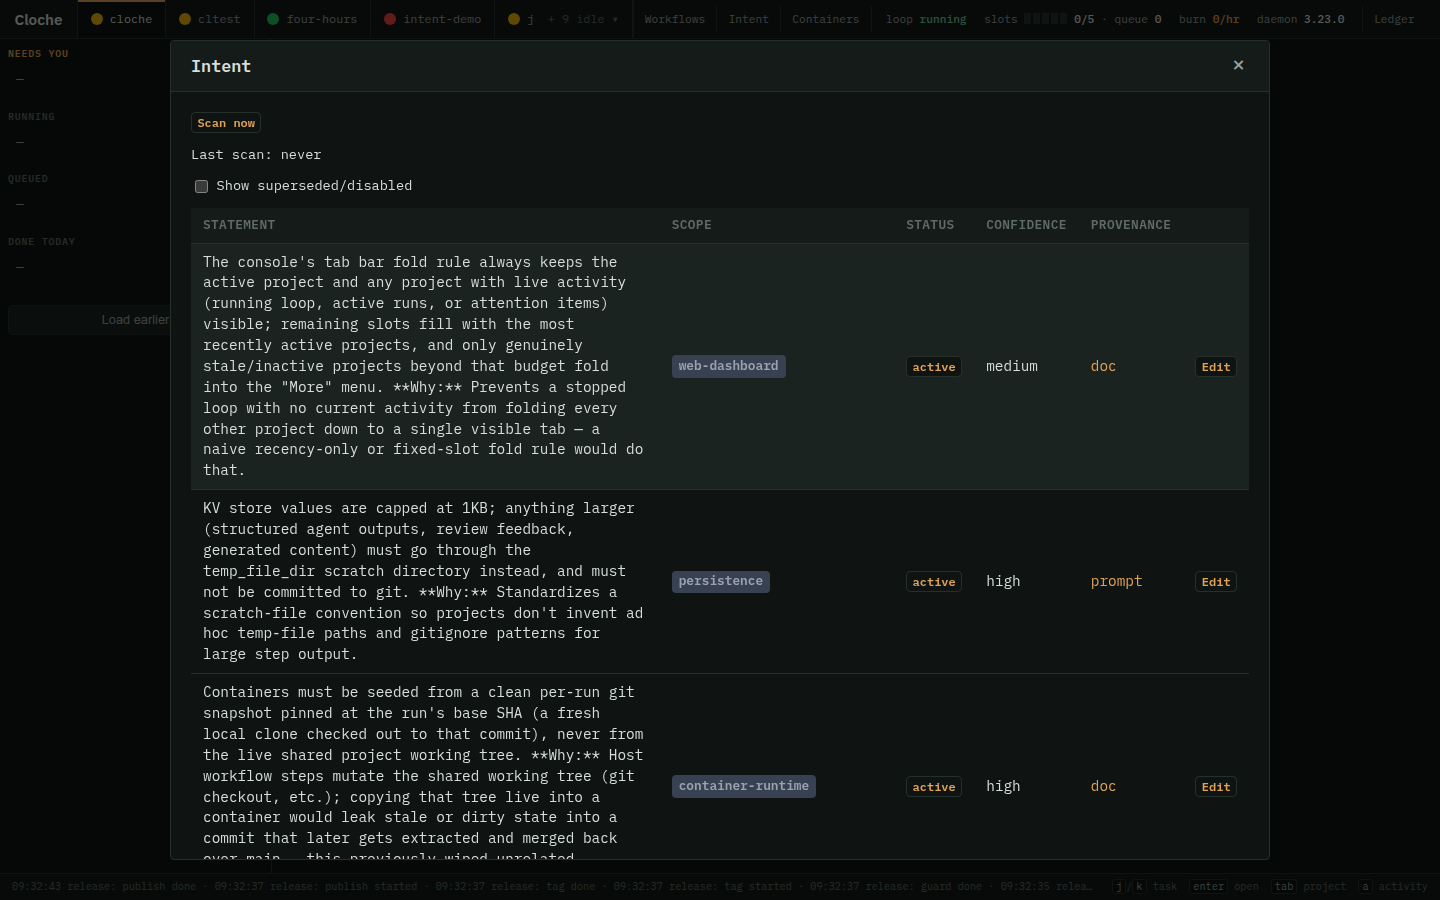
The project’s standing requirements (see Intent Continuity): a requirements table with scope, status, confidence, and provenance, an edit drawer per requirement, the domain editor, and a toggle to show superseded or disabled entries. Scan now dispatches the built-in intent-scan workflow and shows the dispatched run’s ID and live state next to the button, with a link to jump to that run’s task in the stack.
Containers
Retained containers for the project, grouped by task, each with its size and age. Delete a single container or clean up every retained container in the project. There is deliberately no cross-project clean-up button.
Ledger
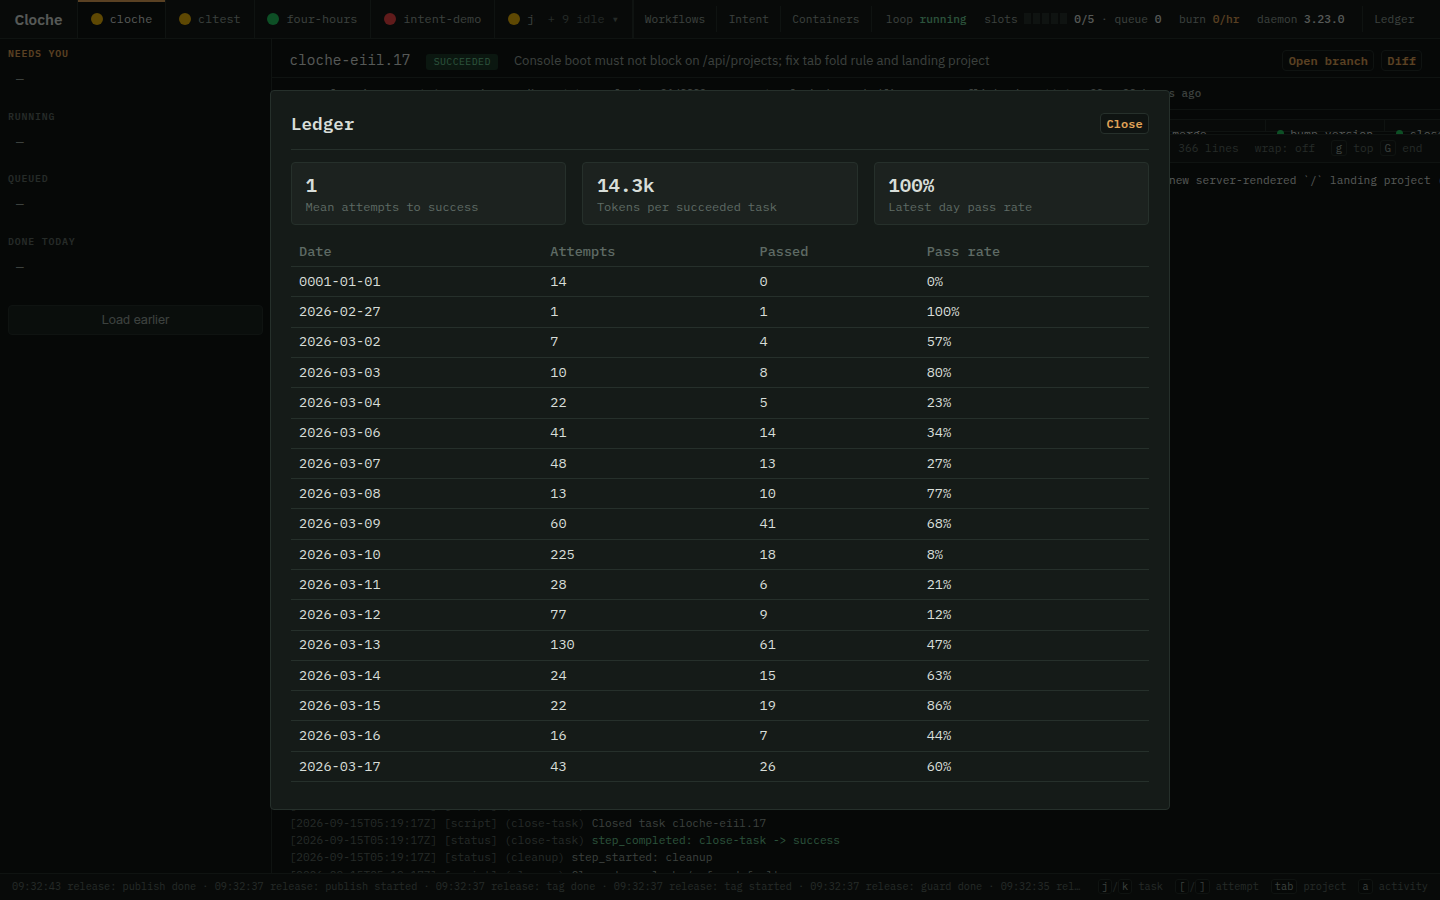
The Ledger instrument (or l) opens a per-project overlay summarising outcomes across every attempt:
- Summary — mean attempts to success, mean tokens per succeeded task, the latest day’s pass rate, and a day-by-day pass-rate table.
- Prompt revisions — for each prompt file used by an agent step, its outcome stats broken out by git revision (newest first), and a before / after comparison for the most recent edit that has recorded attempts.
- Requirements — standing requirements cross-referenced with the tasks whose steps ran with them injected, and the reverse index from task to requirement IDs.
Attribution of an attempt to a prompt revision is recorded when the step is dispatched, keyed by the resolved prompt file and the commit that last touched it. Attempts that predate this recording are backfilled best-effort from git history at the attempt’s start time. Esc or l closes the overlay.
On a project with a long history and many prompt files, the ledger can take a while to compute the first time you open it — the overlay shows “Loading…” until the data arrives.
Token Usage Tracking
Cloche tracks token consumption per agent step and exposes aggregate metrics in the console, cloche status, and a gRPC endpoint.
What Is Tracked
Each completed agent step records:
| Metric | Description |
|---|---|
input_tokens |
Tokens sent to the agent (prompt) |
output_tokens |
Tokens returned by the agent (completion) |
agent_name |
Which agent ran the step (e.g. claude, codex) |
agent_name is the resolved agent command — if the step used a named agent = <identifier> declaration, this is the alias’s expanded command. Rows where the agent can’t be determined are labelled unattributed rather than left blank.
How Tracking Works Per Agent
Claude Code — token usage is extracted automatically from the --output-format stream-json result event. No extra configuration needed.
Other agents — use the usage_command step config key (or set it globally in config.toml under [agents.<name>]) to run a shell command after each agent step. The command must print JSON to stdout:
{"input_tokens": 1234, "output_tokens": 567}
If the command is absent or fails, usage for that step is not tracked. Execution continues normally.
Token Usage in the Console
The tab bar’s Burn instrument shows the active project’s combined tokens per hour over the last hour. The task detail’s facts row shows the selected attempt’s token usage per agent. The ledger reports mean tokens per succeeded task.
Token Usage in cloche status
Overview mode (cloche status with no arguments) shows a per-agent burn rate at the bottom if any usage data exists for the last hour:
Token usage (last 1h):
  claude     4,521 in / 2,103 out   6,624 total   ~18.2k/hr
  codex      1,200 in /   890 out   2,090 total   ~5.7k/hr
Task status (cloche status <task-id>) includes a Tokens line:
Tokens: 8,714 (claude: 6,624 / codex: 2,090)
GetUsage gRPC Endpoint
The daemon exposes a GetUsage RPC on the ClocheService for programmatic access:
rpc GetUsage(GetUsageRequest) returns (GetUsageResponse);

message GetUsageRequest {
  string project_dir    = 1; // empty = global (all projects)
  string agent_name     = 2; // empty = all agents
  int64  window_seconds = 3; // 0 = all time; >0 = seconds back from now
}

message GetUsageResponse {
  repeated UsageSummary summaries = 1;
}

message UsageSummary {
  string agent_name    = 1;
  int64  input_tokens  = 2;
  int64  output_tokens = 3;
  int64  total_tokens  = 4;
  double burn_rate     = 5; // tokens per hour (0 when window_seconds = 0)
}
| Field | Effect |
|---|---|
project_dir |
Limit to a single project. Empty returns global totals. |
agent_name |
Limit to a single agent. Empty returns all agents (one summary per agent). |
window_seconds |
Time window ending now. 0 means no time filter (all-time totals, burn rate is 0). |
JSON API
The console is built on JSON endpoints that are stable and also used by the CLI (cloche health, cloche tasks, and friends). The main ones, with {name} being a project slug:
| Endpoint | Purpose |
|---|---|
GET /api/projects |
Per-project health, active-run count, attention count, loop state, latest run time. |
GET /api/projects/{name}/attention |
The full “Needs you” item list for one project. |
GET /api/projects/{name}/tasks, GET .../tasks/stack |
The loop’s live task snapshot; the grouped, bounded task stack. |
GET /api/projects/{name}/tasks/{taskId}/attempts |
A task’s attempts, oldest first, each with run ID, outcome, duration, retry reason, and failed_step. |
POST .../tasks/{taskId}/release, POST .../tasks/{taskId}/close, POST .../tasks/{taskId}/run-once |
Release a stale claim; run the close-task / cancel-task contract (501 with a hint when undefined); dispatch a single attempt outside the loop. |
POST /api/projects/{name}/attention/mute |
Mute a “Needs you” item by key (built-in failures only). |
GET .../loop/status, POST .../loop/stop, POST .../trigger |
Loop control. |
GET .../loop/occupancy, GET /api/projects/occupancy |
Concurrency slots and queue depth, per project and overall. |
GET /api/projects/{name}/usage |
Token burn rate and 24h totals, per agent. |
GET /api/runs, GET /api/runs/{id}, GET /api/runs/{id}/stream |
Run listing, run detail (steps, child runs, container state, tokens per agent, prompt file and revision), live SSE log stream. |
GET /api/runs/{id}/steps/{step}/output |
A single step’s raw output. |
GET /api/runs/{id}/thread, POST /api/runs/{id}/thread/reply |
The help thread a parked run is waiting on, and replying to it (resumes the run). |
GET /api/runs/{id}/branch, GET /api/runs/{id}/diff, GET /api/runs/{id}/console |
Extracted result branch(es), their diff against the base revision, and the raw container log. |
GET /api/attempts/{id}/stream, GET /api/attempts/{id}/logs |
SSE streaming and paginated log lines across an attempt’s host run and child runs. |
GET /api/activity |
The activity stream, filtered by ?project=<slug> and ?failures_only=1, paged with ?before=<cursor>&limit=<n>. |
GET /api/projects/{name}/workflows, GET .../workflows/{workflow}/steps/{step}/content |
Workflow structure and step content for the Workflows view. |
GET / PATCH /api/projects/{name}/intent/requirements, GET / PUT .../intent/domains, POST .../intent/scan |
Intent requirements, domain map, and scan dispatch. |
GET /api/projects/{name}/containers, DELETE .../containers, DELETE /api/runs/{id}/container |
Retained-container listing, project-scoped clean-up, single delete. |
GET /api/projects/{name}/ledger |
Pass rate over time, attempts and tokens to success, prompt-revision outcomes, requirement cross-references. |
GET /api/failed-tasks |
Failed-but-still-open tasks and built-in workflow failures. |
Features at a Glance
| Feature | Where |
|---|---|
| Live log streaming (SSE) with per-step scoping | Task detail — log pane and step strip |
| “Needs you” triage with one-click actions | Task stack — Needs you group |
| Reply to a parked agent question | Task detail — parked pane |
| Attempt comparison for repeated failures | Task detail — compare view (c) |
| Workflow DAG with step drawer | Workflows view (w) |
| Standing requirements editor and scan | Intent view (i) |
| Retained container clean-up | Containers view (c) |
| Pass-rate history and prompt-revision outcomes | Ledger (l) |
| Activity ticker and stream | Foot bar / a |
| Loop start / stop, slot occupancy, burn rate | Tab bar instruments |
| Open branch, diff, cancel, delete container | Task detail — header actions |